
FAQ
Design Decisions
How is the HPC stack setup and why?
The HPC stack is designed to provide a seamless experience while also reducing the barrier to entry while offering fair and equitable access to a shared resource. Open Ondemand allows for a simple and flexible job UI for spawning interactive jobs like jupyterhub, R Studio, vs-code, a Linux desktop environment, etc. and If you prefer to use CLI tools you can ssh to hpc.grit.ucsb.edu and your ssh session will be launched within the SLURM queue. We chose this design as it forces all tasks to be submitted within the SLURM queue. This prevents over constraint of system resources which is a common cause of system crashes or similar disruptions. 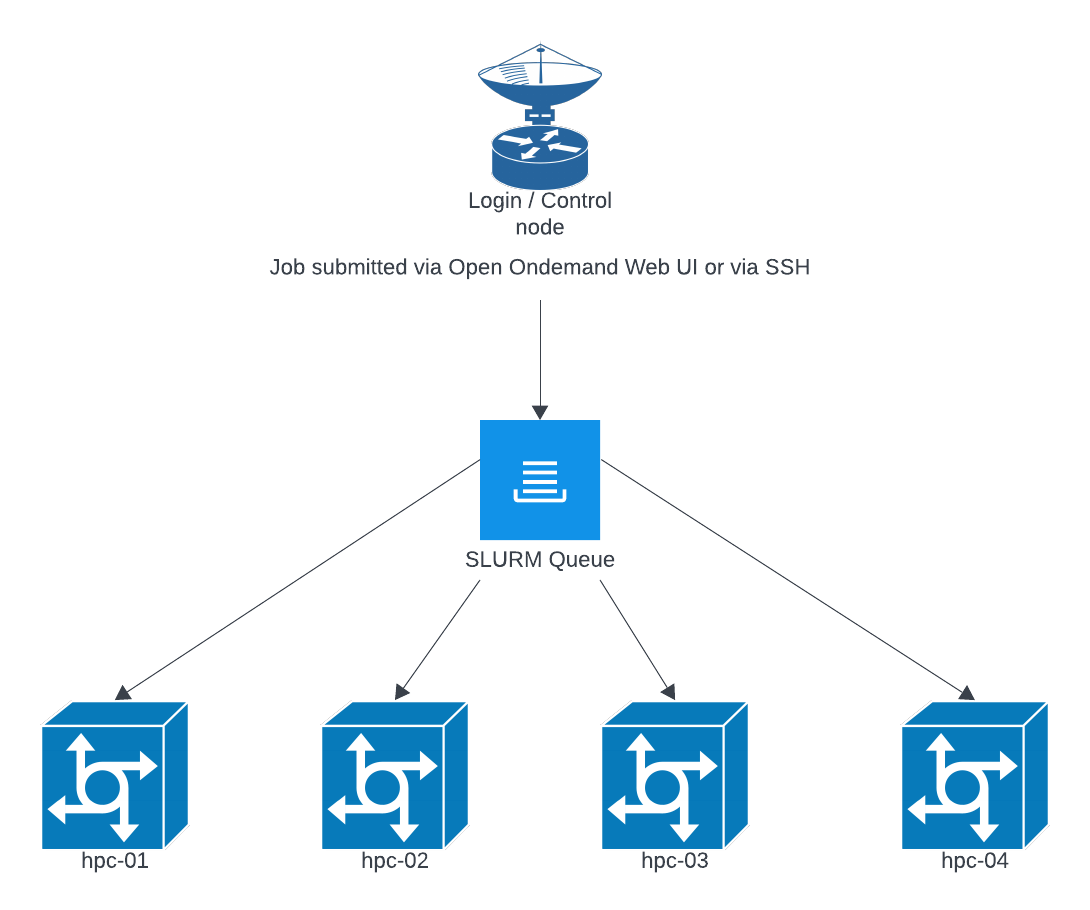
The SLURM queue will generally round robin jobs across nodes to try and keep resources evenly used across nodes. This allows us to perform maintenance on individual nodes without disrupting the overall queue, and to add and remove nodes as needed. The exception is when GPU resources are requested, those will be forced onto a more limited number of nodes that have available GPU resources.
Selecting Job Resources (more resources doesn't make it faster):
When starting a job you are given options for the amount of CPU and RAM that will be allotted to the job. Selecting too few resources can result in the job failing, and selecting too many can result in the job waiting in the queue for resources to become available. We have provided a dashboard to check the status of currently running jobs to see what resources they have consumed so far, it is available here: https://hpc.grit.ucsb.edu/pun/sys/job-efficiency/. This page will provide guidance on what resources to select for the next run of your job.
Jupyterhub
Generally python / jupyterhub jobs will be single threaded and only use a single CPU core unless otherwise specified. Common libraries to check for that enable multi-threading are the following:
- NumPy
- SciPy
- NumExpr
- Numba
- TensorFlow
- PyTorch
If one or more of these libraries are you please do a trial run with 2-4 cores and verify that they are being utilized with the job resource utilization analyzer.
R Studio
Generally R Studio jobs will be single threaded unless a specific library or function are called. Some common things that enable multi-threading are listed below:
- OMP_NUM_THREADS
- MKL_NUM_THREADS
- OPENBLAS_NUM_THREADS
- RhpcBLASctl
- data.table::setDTthreads
- future
- parallel
- foreach; control with worker count (plan(multisession, workers=…), makeCluster(n)).
Cluster Scratch Directory
There is a scratch directory at /home/hpc-scratch. Note that this is not backed up and data that has not been accessed for 30 days will be AUTOMATICALLY DELETED.
Checking Past Job Usage on the Cluster
Command
sacct --units=G \
      --format=JobID,User,State,Elapsed,ReqMem,MaxRSS,MaxVMSize,AllocCPUS,TotalCPU
This command shows details about previous Slurm jobs, including memory usage, runtime, and CPU allocation.
Column Descriptions
JobID
The unique identifier for the job.
You may see additional job step entries:
-
12345— the main job -
12345.batch— internal batch step -
12345.0— a job step launched bysrun
Most users only need to pay attention to the main job ID.
User
The username that submitted the job.
State
The final status of the job.
Common values include:
| State | Meaning |
|---|---|
| COMPLETED | Job finished normally |
| FAILED | Job exited with an error code |
| CANCELLED | User or admin cancelled the job |
| TIMEOUT | Job exceeded its wall time |
| OUT_OF_MEMORY | Job exceeded its memory request and was terminated |
Elapsed
The total wall-clock runtime of the job.
Format may be HH:MM:SS or D-HH:MM:SS.
Examples:
-
02:34:10→ 2 hours, 34 minutes -
1-00:00:00→ 1 day
ReqMem
The amount of memory you requested when submitting the job.
This is what Slurm reserved for your job.
Examples:
-
4G— requested 4 gigabytes -
0— no memory explicitly requested
If your job frequently runs out of memory, increase this value in future submissions.
MaxRSS
The maximum actual memory used by the job, shown in gigabytes (because of --units=G).
Examples:
-
1.5G— peak memory use was 1.5 GB -
12G— peak use was 12 GB -
0.00G— minimal usage or incomplete accounting information
Use this value to compare actual usage with your requested memory.
MaxVMSize
The maximum virtual memory used.
This includes allocated but not necessarily resident memory.
This is mostly useful for debugging highly memory-intensive applications.
Most users do not need to focus on this field.
AllocCPUS
The number of CPU cores allocated to your job.
Examples:
-
1— single-core job -
8— job received 8 cores
This corresponds to values requested via --cpus-per-task, --ntasks, or submission defaults.
TotalCPU
The total CPU time used across all allocated cores.
For example, if a job runs for 1 hour on 4 cores and keeps all cores fully busy:
TotalCPU = 4:00:00
Interpreting this value:
-
If TotalCPU is close to AllocCPUS × Elapsed, the job is CPU-bound.
-
If TotalCPU is much smaller, the job spent time idle, waiting for I/O, or was lightly loaded.
Example: Show Jobs From the Last 7 Days
sacct --starttime=$(date -d '-7 days' +%Y-%m-%d) \
      --units=G \
      --format=JobID,User,State,Elapsed,ReqMem,MaxRSS,MaxVMSize,AllocCPUS,TotalCPU